ServicesCase StudiesAboutBlogContact+1 347 389 5523

Data & Reporting Automation

Automated ETL pipelines, real-time dashboards, and scheduled reporting so leadership always has the numbers they need without anyone pulling CSVs.

Automated ETL pipelines across your stackReal-time dashboard syncing (Looker, Tableau, Metabase)Scheduled report delivery to Slack or emailData quality monitoring and alertingCustom KPI tracking and anomaly detection
Chat on WhatsAppFree Consultation

Data and Reporting Automation: Decisions on Real-Time Numbers, Not Last Week's CSV

If your leadership team is waiting for Monday morning to find out what happened last week — or worse, waiting on an analyst to "pull the numbers" before making a decision — you're flying blind. Data automation closes the gap between data and decision: ingestion runs on schedule, transformation happens automatically, dashboards refresh in real time, and the right people get the right numbers without anyone touching a spreadsheet.

What We Build

  1. Automated ETL pipelines. Data flows from every operational system — CRM, ERP, billing, product analytics, marketing platforms, customer support — into your warehouse continuously. Built on dbt + Airflow for transformation, or low-code platforms like Fivetran + Hightouch for simpler stacks.
  2. Real-time dashboards. Live executive dashboards in Looker, Tableau, Metabase, or Mode showing revenue, pipeline, customer health, product engagement, and operational KPIs — all updating without manual refresh.
  3. Scheduled report delivery. Automated reports landing in Slack channels, email inboxes, and stakeholder dashboards on the cadence the business needs — daily, weekly, monthly — with narrative commentary generated by AI when useful.
  4. Data quality monitoring. Programmatic checks catching upstream schema changes, missing data, anomalous values, and pipeline failures before they corrupt dashboards. Alerting to the data team within minutes, not days.
  5. Anomaly detection and alerting. ML-based anomaly detection on critical KPIs — a sudden conversion drop, an unusual churn spike, a revenue anomaly — surfacing issues before they become trends.

The Stack We Build With

Snowflake, BigQuery, or Redshift for the warehouse. dbt for transformation. Airflow, Prefect, or Dagster for orchestration. Looker, Tableau, Metabase, Mode, or Hex for visualization. Hightouch or Census for reverse ETL when operational tools need the warehouse data back. We pick the stack that matches your team's skills, your data volume, and your budget — not the trendiest tools.

What Changes After This Engagement

Leadership decisions are made on current data rather than last week's snapshot. Operational teams have the numbers they need without pinging the analyst team. Data team capacity shifts from "running reports" to "answering interesting questions." And the cost of new reporting drops dramatically — adding a new dashboard becomes a 2-hour task instead of a 2-day project.

Related Articles

More Services

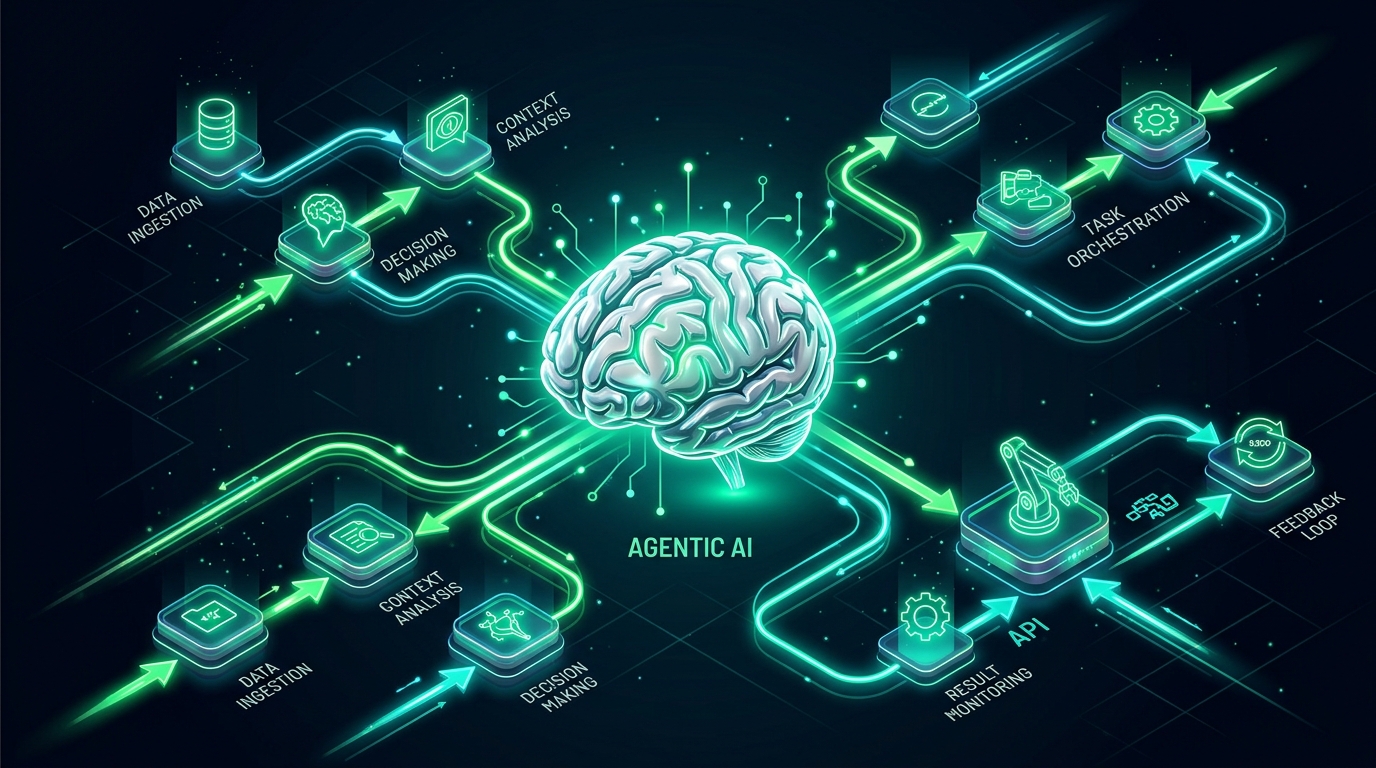
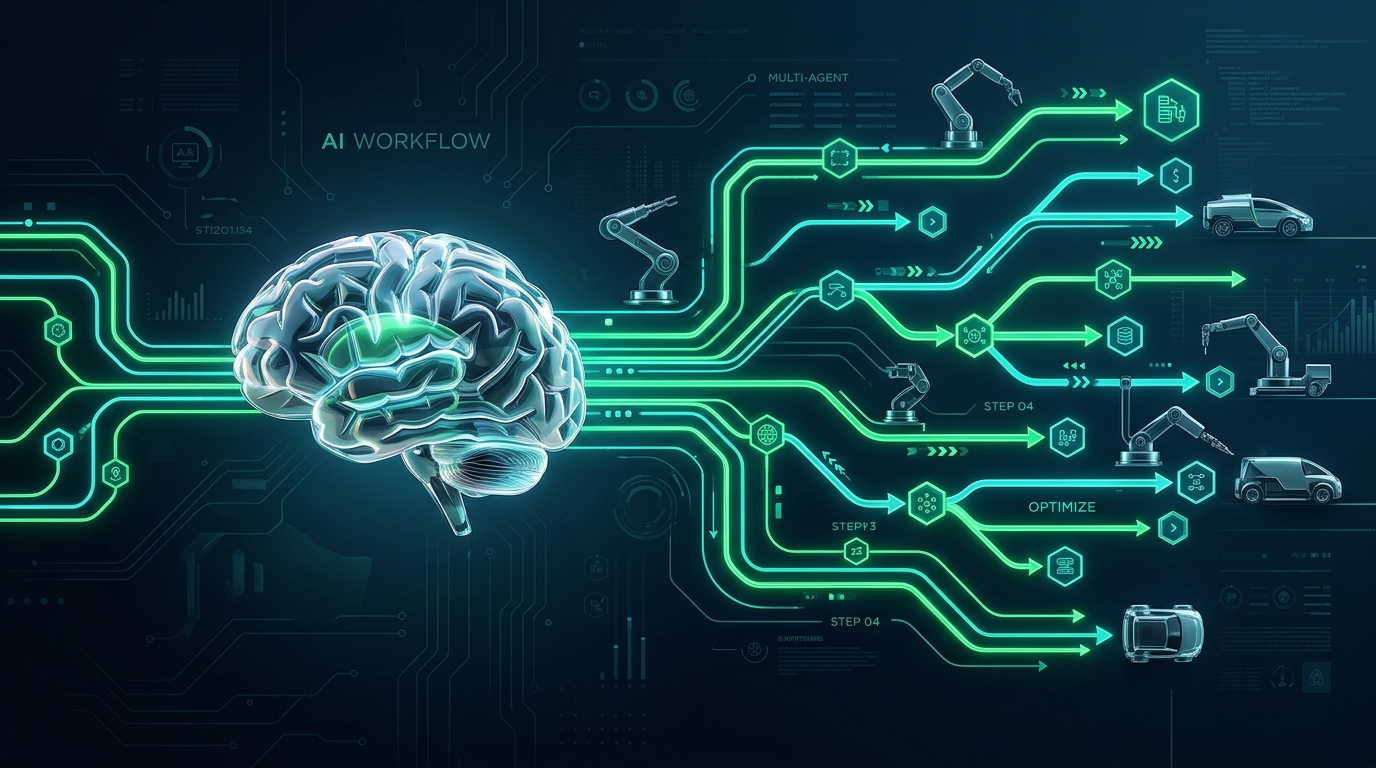
Agentic AI Workflows
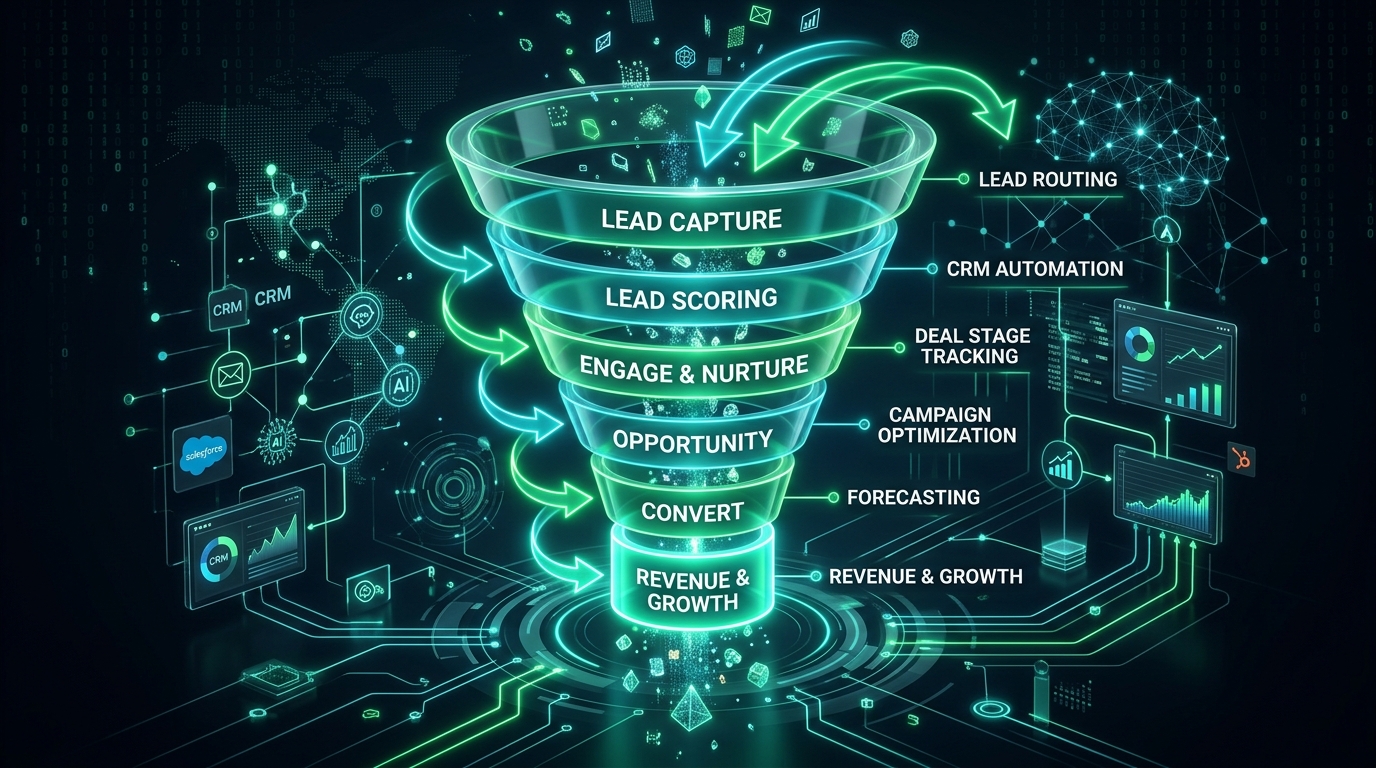
Revenue Operations AutomationBack-Office & Operations AutomationAI Customer Service AutomationAutomation Strategy & Roadmapping

Let's build something great together — get in touch

Ready to Get Started with Data & Reporting Automation?

Start Your SaaS Journey
Data & Reporting Automation | Automation AI Agency